I’ve long needed a single source to point people to when it comes to debugging and logging in SharePoint. I’m sure someone will say “oh look at my post” in a comment when this is read… please feel free to add comments to this post pointing to your debugging tricks.
When developers get tripped up with a nasty bug or something when building custom components in SharePoint, from Web Parts to server controls or even custom Features without a line of custom code (just loaded up with CAML)… well, effective debugging and logging can turn into being a developers best friend and get them out of a bind.
In my mind for you to be a SharePoint developer worth your pay, you must know how troubleshoot… heck… to be any kind of developer, you MUST know how to troubleshoot on your own. The trick is SharePoint can be quite daunting for those new to the platform and need a little help. Hopefully what follows will help you too!
Debugging Tips & Techniques
Attaching the debugger
First and foremost, any SharePoint developer must be able to attach the Visual Studio debugger. Let’s face it, unless you’re using the VSeWSS or creating a workflow using Visual Studio 2008, F5 just doesn’t work. You will have to manually attach the debugger. Well, it isn’t that hard.
Attaching the debugger to GAC’d assemblies
“Why aren’t my breakpoints being hit?!?!” Ever been there? Me too… what a PITA that is! What’s going on? Well, the assemblies are in the GAC and the Visual Studio debugger can’t see the debugging symbols (aka: *.pdb). Unless you’ve gone through the trouble of setting up a symbol store where all your PDBs are going, you’ll need to put the debugging symbols in the same location as the assembly. The trick is finding the folder that contains your DLL in the GAC.
The c:\windows\assembly folder is not a real folder, it’s a virtual folder. To get to the REAL folder, do the following:
- Start - Run
%systemroot%\assembly\gacENTER
This will open the GAC folder. Now, poke around until you find a folder that looks like this (you might need to jump up one folder and dive into the MSIL folder): [assembly file name -.DLL extension][assembly version in format of #.#.#.#][assembly public key token].
When you find that folder, open it up and you’ll see your assembly. Copy the PDB file to that folder and then attach the debugger for some debugging joy!
Gimme my ASP.NET YSOD!
You’ve seen it… something errors out and all SharePoint says is “unknown error occurs.” Great… thanks guys… about as helpful as “service engine soon” on my truck’s dashboard. Arg! Not all errors are shown because that would be a security issue. So how do you get it? Just turn the callstack on and the custom errors off as shown in this post. Another awesome option is Ted Pattison’s debugging Feature. Ted blogged it up here, but you can download it from his site here; you want the SharePointDebugger.zip file. This guy is a Web application scoped Feature that makes these changes for you.
Debugging Feature receivers & timer jobs
These can be one of the toughest things to debug. They fire and sometimes are hard to catch or know if they blew past your breakpoint. “Am I even attached to the right process?” Even the most seasoned hit this. I’ve got a little trick I picked up along the way that helps. In my MSDN timer job article I show a technique of using an Assert (jump to the bottom, the section on Debugging Custom Timer Jobs). If you add the following code, a dialog will pop up on the server when it hits that line and will wait for you to address it:
System.Diagnostics.Trace.Assert(false)
That gives you plenty of time to attach the debugger to the right process.
Debugging tools
Walk, don’t run, and get the following:
- Reflector: lets you peek into compiled assemblies.
- DebugView: look at everything you emit in the debug statements.
- Fiddler: HTTP debugging proxy letting you see all traffic on your machine.
- SharePoint Manager 2007: Don’t go in the database… use this guy to see everything in your farm!
Debugging resources
- Tess’ blog: If it’s broken, fix it you should: a fantastic title! Got some free time? Check out her awesome debugging demos!
- Vincent Rothwell’s Debugging tips for SharePoint: ladies and gents, THE definitive source starting high level and going all the way into windbg!
- **Debugging Microsoft .NET 2.0 Applications: by John Robbins - low level stuff, but it all applies to SharePoint.
Logging Tips
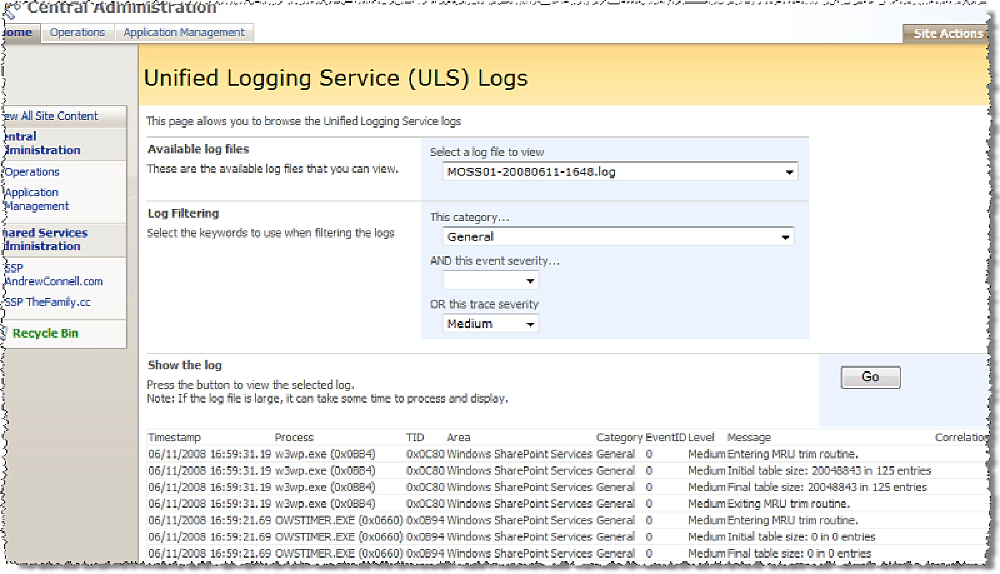
LogViewer Feature: All those log files in the [..]\12\LOGS folder are hard to look at… what a pain to read! I know… go get a browser-based viewer snapin by Scot Hillier. This adds a new link to the Central Administration Operations page that lets you pick & filter the log files. Download it from the CodePlex Features project.

Scot Hillier's LogViewer Feature
Throttle Logging
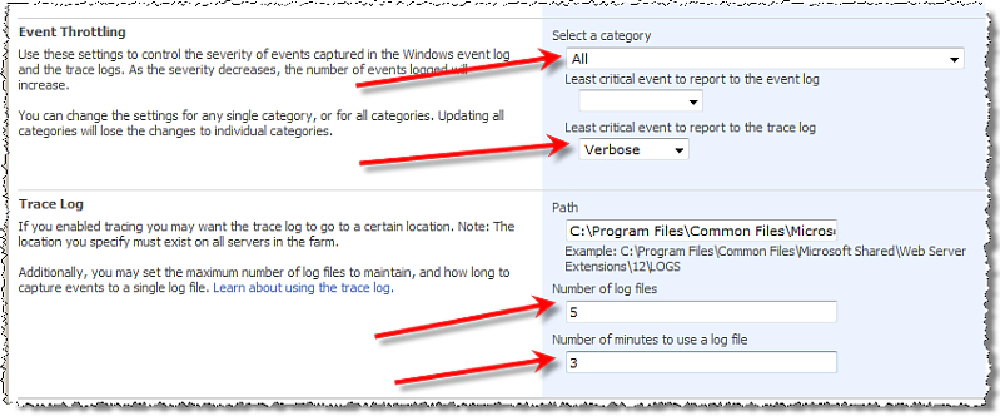
Let’s face it, if you are debugging, you’re only interested in what happened in the last few seconds or minutes on your server. You don’t need a ton of log files. Plus, you need them to be much more manageable. Go Central Administration - Operations - Diagnostic Logging. On this page you can set the number of log files to retain and how long each one should run. I set the values on my dev machines to only run for 3 minutes and keep the last 5 log files.
You can also turn on verbose logging… this will make the machine slow down a bit, but you’ll get a TON of data. This is great for debugging problems with Feature activation… sometimes it even points to the specific XML/CAML node that’s causing the issue! Just a word of warning… don’t leave verbose enabled on your production box… SharePoint turns into one chatty app and those log files fill up! But more data points is always better than less when debugging!

How I like to set up my logging when I'm troubleshooting on a development machine
Hope this helps!