In my previous posts I mentioned the different tools you can use to code in Node.js. Microsoft stepped up to the plate and provided an add-on to Visual Studio for Node.js development. If you want to see the development and debugging story around that, I’d recommend checking out the official page for the tools, as well as their YouTube channel and a good post by John Papa: Get Up and Running with Node & Visual Studio. However as I said, I’m going to focus on using Visual Studio Code for the remainder of this series. In this post I want to not just explain what the development and debugging workflow process is like, but I’d like to explain how it works. A lot of this is abstracted away from you if you’re using Visual Studio but like every good developer, you want to know how this stuff works… so here’s my spin on it! Before I show you how you can debug in Visual Studio Code, let’s first look at debugging Node.js at it’s core.
Sample Node.js Site - Get it Working
For this post I’m going to use a very simple Node.js website that you can get from my public GitHub repository. This site implements the MVC pattern with a single view and controller… I’ll look at the MVC aspects of this more in a later post. Let’s focus on running this sample first. To run this you first have to put all the code in one spot and then run the command: npm install which will download the two required npm packages required to run the sample (Express, which is the web server & HBS, which is the server-side implementation of the popular handlebars data binding framework used for MVC in this example).
Once you’ve done that, from the root directory of the project, run the website by typing node src/server/server.js at the command line. This will start the Express web server and host the site at http://localhost:3000. Open a browser and navigate to that site… it’s pretty basic. Stop the site by pressing
CTRL
+
C
.
Understanding Node.js Debugging
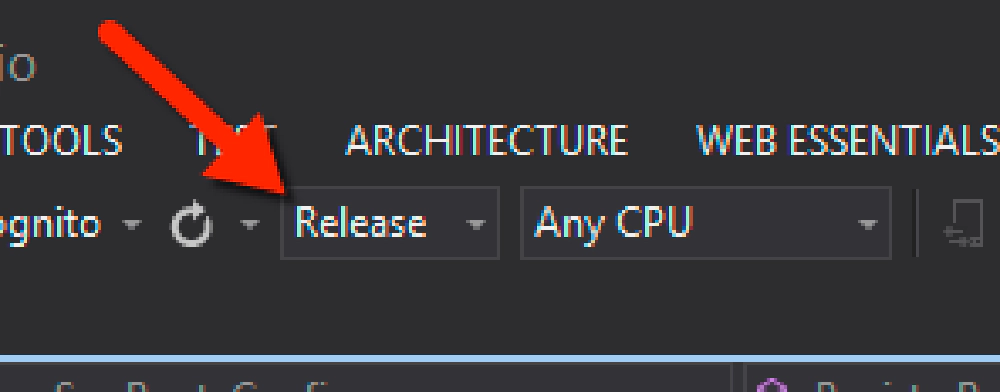
When you run the site the way we did above using node src/server/server.js you are running in the production mode. For .NET developers, this is like running in the Release build configuration in Visual Studio.

Visual Studio's Release button
Similar to Visual Studio, running in production / release mode means you don’t get additional debugging data emitted from your process. In .NET this means you have no debugging symbols that map the compiled code to your source code so you can’t set breakpoints and the like. The same is true in Node.js. When you want to run in debug mode in Visual Studio, you run in Debug mode:

Visual Studio's Debug button
To run in debug mode in Node.js, you simply add a flag when you start the process: node --debug src/server/server.js. When you do that, you’ll see on the command line that Node.js reports that the debugger is listening a specific port:

Node's debugging port
What does this give you? This means the Node.js process has an open port where extra debugging data is emitted and you can talk to Node from different tools. This allows you to set breakpoints, get data about the script running & the overall Node.js process… tons of stuff.
But by itself, this won’t help you… what you want are some tools…
Inspecting the Node.js Process with Node Inspector
The best tool to go grab is node-inspector. I’d install this globally via npm on your dev system just like they suggest in the quick start docs. This utility is provided by StrongLoop.
Before I explain what it does, let’s take a quick tangent… what is the best tool available to debug & step through your client-side code? It’s easily your favorite browser’s developer tools. Personally I think Chrome has the best developer tools out there… but let’s not get into a debate about that. So since these tools are fantastic for debugging & stepping through your client-side JavaScript code, why not use them for your server-side development debugging?
What node-inspector does is spin up a locally hosted website that interacts with the Node.js debug port. You then use the Chrome or Opera browser to connect to this website. When you open this node-inspector hosted site in one of these browsers, the entire browser loads the dev tools… but it doesn’t include client-side JavaScript, it contains your Node.js server-side JavaScript! This is awesome because you are now using the exact same tools to debug, step through, set breakpoints and even profile your client-side and server-side JavaScript code!
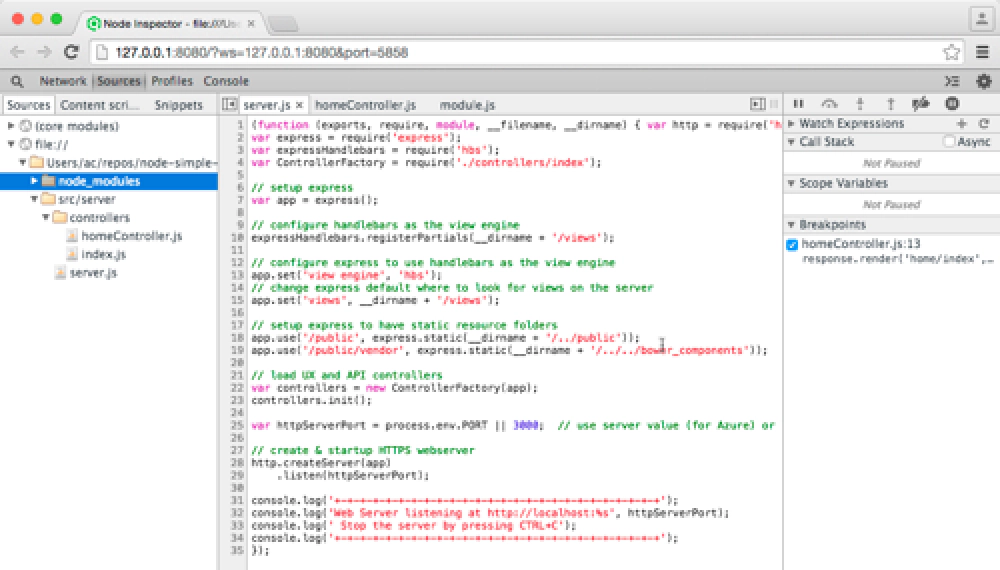
So how do you use it? From the command line you have two options. If you run node-debug src/server/server.js you’ll see a new browser window open and load the tools:

Node debugging tools in Chrome
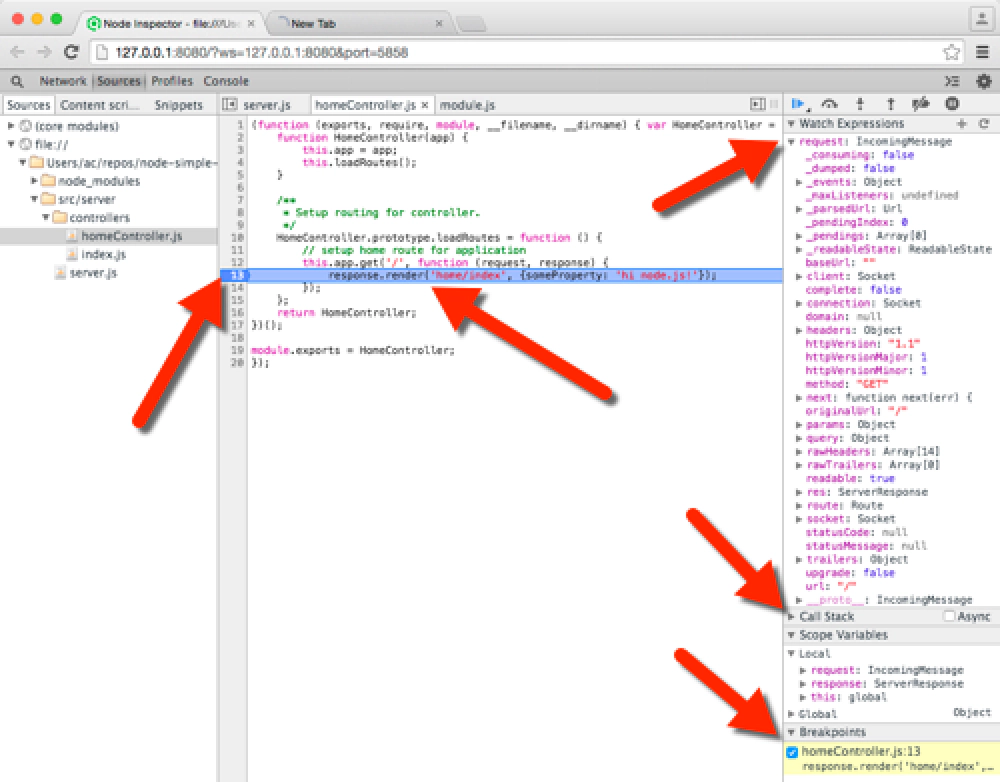
You can see on the left-hand side our Node.js website JavaScript codebase. In the middle you can open JavaScript files and on the far right, you can explore all sorts of things. It’s just like debugging client-side web applications. Open the homeController.js file and set a breakpoint on line 13 where the page responds to a HTTP GET request. Then open another browser window and navigate to http://localhost:3000. You’ll see node-inspector work with Node.js’ debugging port and stop at that breakpoint. From here you can step through the code, see local variables, call stacks, set watches.. you name it.

Node's debugging tools with node-inspector running
Live Debugging
What do I mean by this? Well you know how in a traditional ASP.NET web application or MVC application when you make a change to the code, you have to stop & restart the server to recompile everything? Same thing is true with Node.js… all the JavaScript is sucked into the Node.js process and V8 engine when you start the server. If you change a JavaScript file you have to stop & restart the process to get your changes reloaded.
Well there’s a slick little utility you can set that will monitor your JavaScript files for changes. If one changes it can stop & restart the Node.js process automatically so you don’t have to worry about this at all. In fact, you just keep coding away and let the process keep doing this in the background for you. Pretty slick huh?
Check out the node-inspector site for a bunch of ways you can configure it such as ways to hide certain files from showing up in the debugger tools (such as hiding the node_modules directory if you don’t want to debug or step through packages you rely on).
This is done using the tool nodemon. The way I run nodemon & node-inspector together is by running a command like this:
node-inspector --web-port=8888 & nodemon --debug src/server/server.js
This will start Node.js in debug mode as well as node-inspector and watch for any changes to any file within your site:

Using nodemon & node-inspector
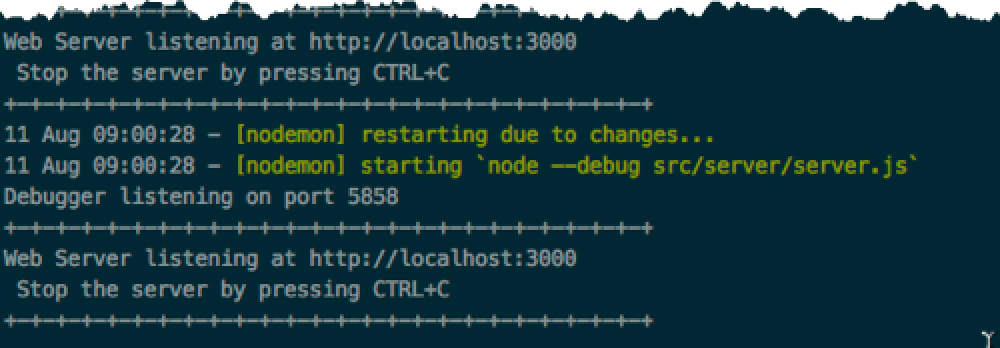
Open a browser and navigate to both your site & the node-inspector site. Now, go back to your code and make a change to a JavaScript file like add some spaces to a string and hit save. In the console you see nodemon picked up the change and restarted the service (something you could manually do at the console by typing rs and pressing
ENTER
) and the node-inspector browser tools refreshed.

Nodemon picking up changes and restarting the service
Pretty cool huh? So at this point you’ve seen how to do some basic debugging by using a few handy free tools. In the next post I’ll take this a step further and show you how you can debug your Node.js apps within Visual Studio Code.